TarGOST® Log

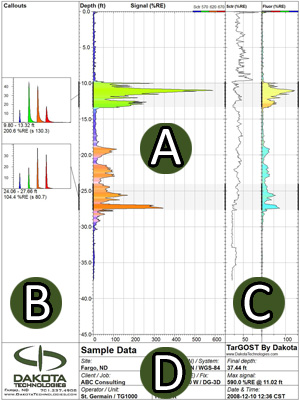
A: Main Plot
Signal versus depth where signal is relative to the Reference Emitter (RE). For TarGOST data, the signal is scatter corrected due to tar’s non-linear fluorescence with increasing concentration. The fill color is based on relative contribution of each channel's area to the total waveform area (see callout waveform). The first channel (blue) is always representative of the scatter.
B: Callouts
Waveforms from single depths or depth ranges showing the multi-wavelength waveform for that depth. Basic waveform statistics and any operator notes are given below the callout.
The four peaks (referred to as channels) are due to laser scatter and fluorescence at three wavelengths. Each channel is assigned a color. Various NAPLs will have a unique waveform fingerprint due to the relative amplitude of the four channels and/or broadening of one or more channels.
C: Scatter & Fluorescence Plots
The Scatter Plot is the scatter (channel 1) versus depth. Scatter routinely drops as tar concentration increases.
The Fluorescence Plot is the fluorescence signal (channels 2 to 4) alone versus depth. In this plot, the scatter channel is not used in the calculation of signal intensity or coloring. Note the coloring key at the top of the plot. Intensity unit is percent of Reference Emitter fluorescence. Varying soil or product can often be visually pulled-out from the background based on the fill color of this plot if scatter dominates the color of the main plot.
D: Info Box
Contains pertinent log info including name and location.
TarGOST+HP Logs
 In addition to the features of the standard TarGOST log, the TarGOST+HP log shows injection pressure and a corresponding volume of injected water data directly on the log (far right columns). As with the standard TarGOST log, following data acquisition, the operator may output a jpeg image or pdf of the data. The operator also has control over the three callouts shown on the left side and the scale of the depth and signal axis. Click for a larger image.