Understanding Waveforms
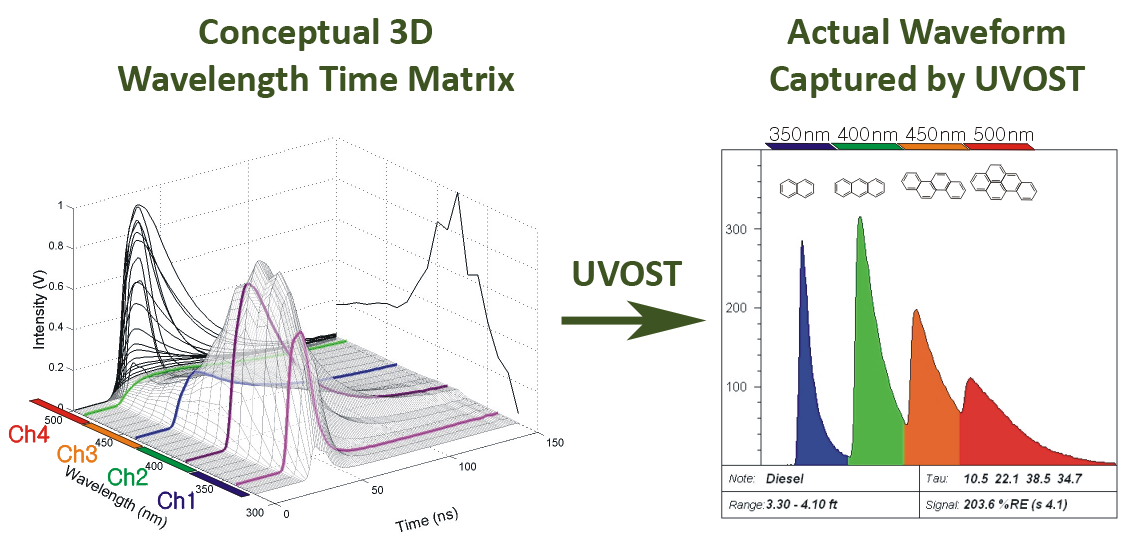
The left side of image below illustrates the combined spectral/temporal nature of the fluorescence emitted by the polycyclic aromatic hydrocarbons (PAHs) in diesel, and the right side shows the 2D style waveform measured and stored by Dakota's LIF instrument.

Key characteristics of waveforms
Intensity
- The y-axis represents the intensity or brightness of the fluorescence
- Intensity generally increases with increasing fuel/oil pore saturation
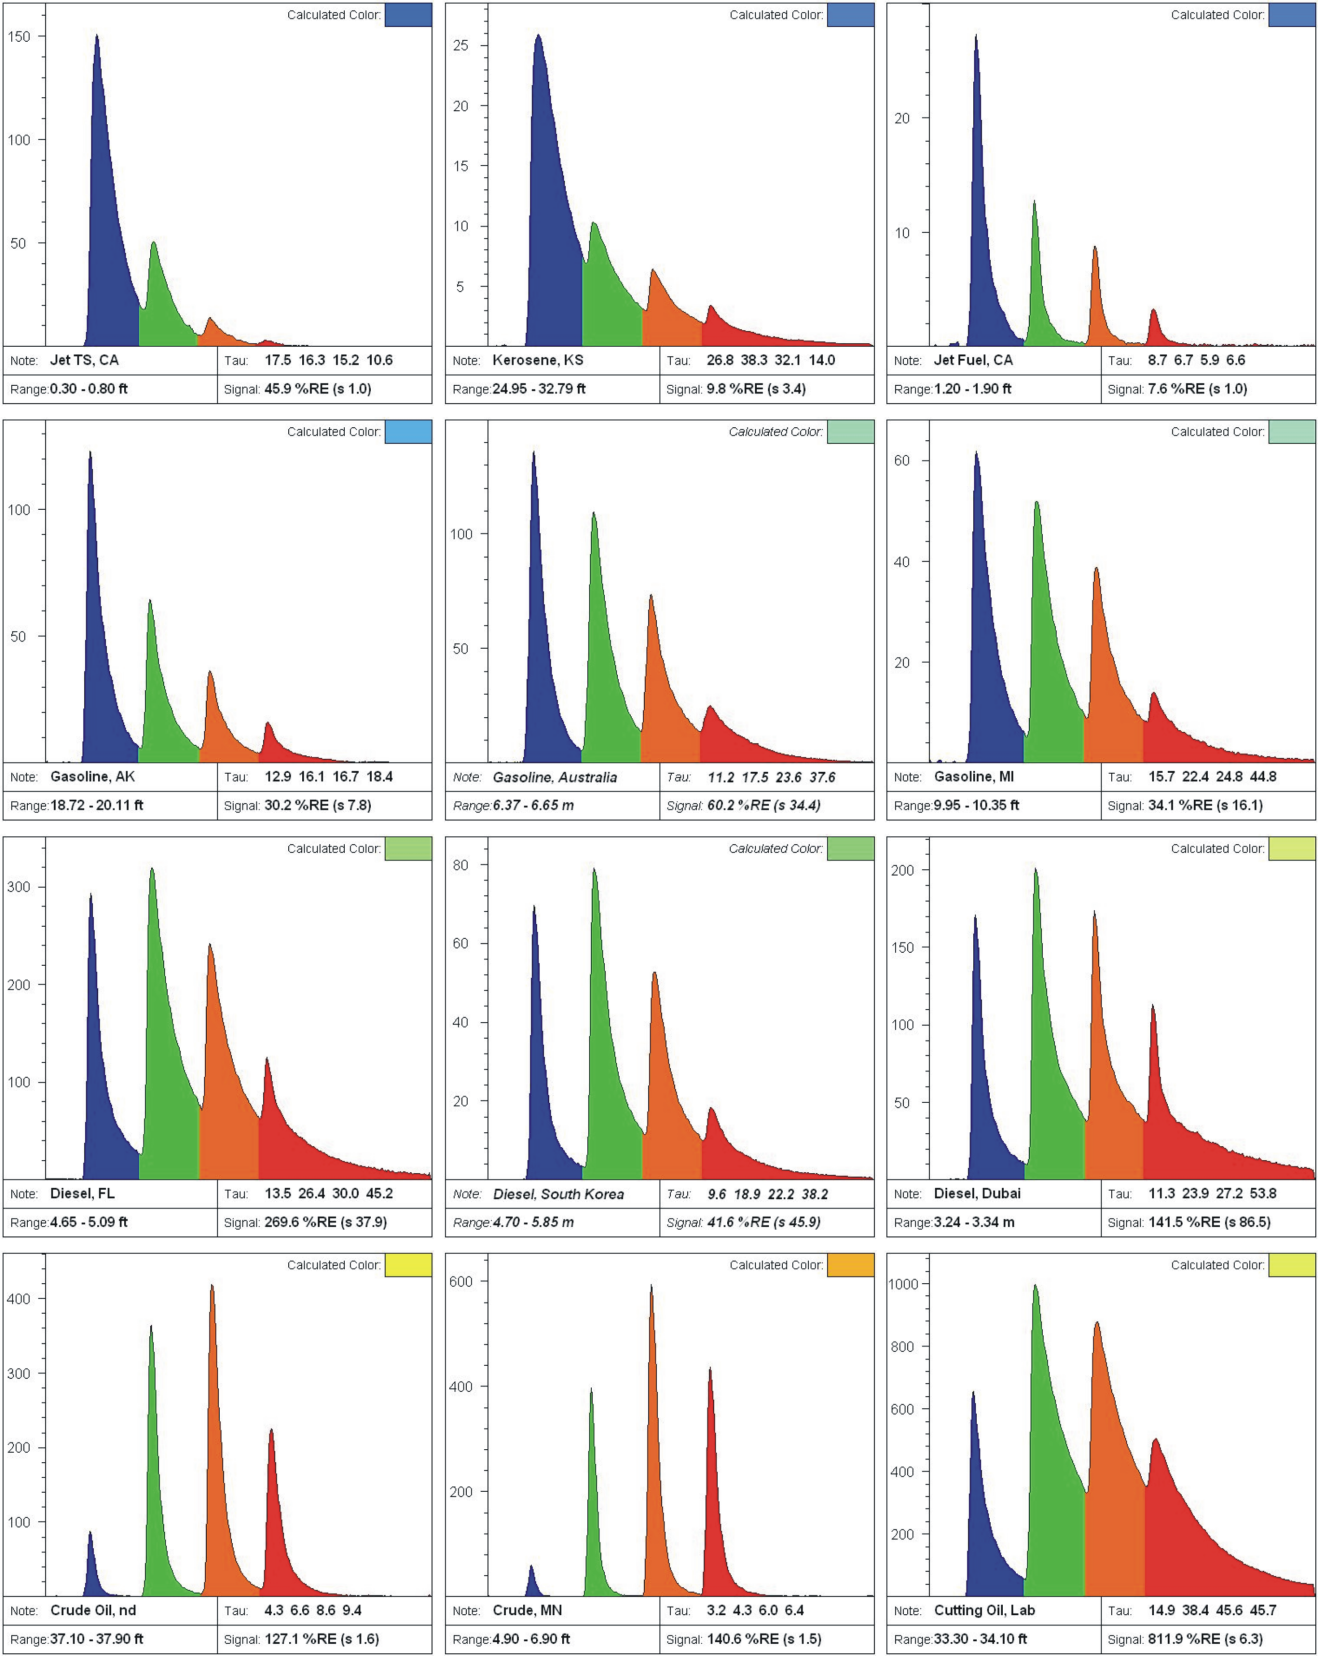
- The relative fluorescence intensity is dependent on the composition of the fuel
Wavelength
- Four wavelengths of fluorescence arrive at the detector at sequentially delayed times
- The relative intensities of the four channels determine the fill color of the signal vs. depth LIF log allowing differences in waveforms to be intuitively differentiated at a glance
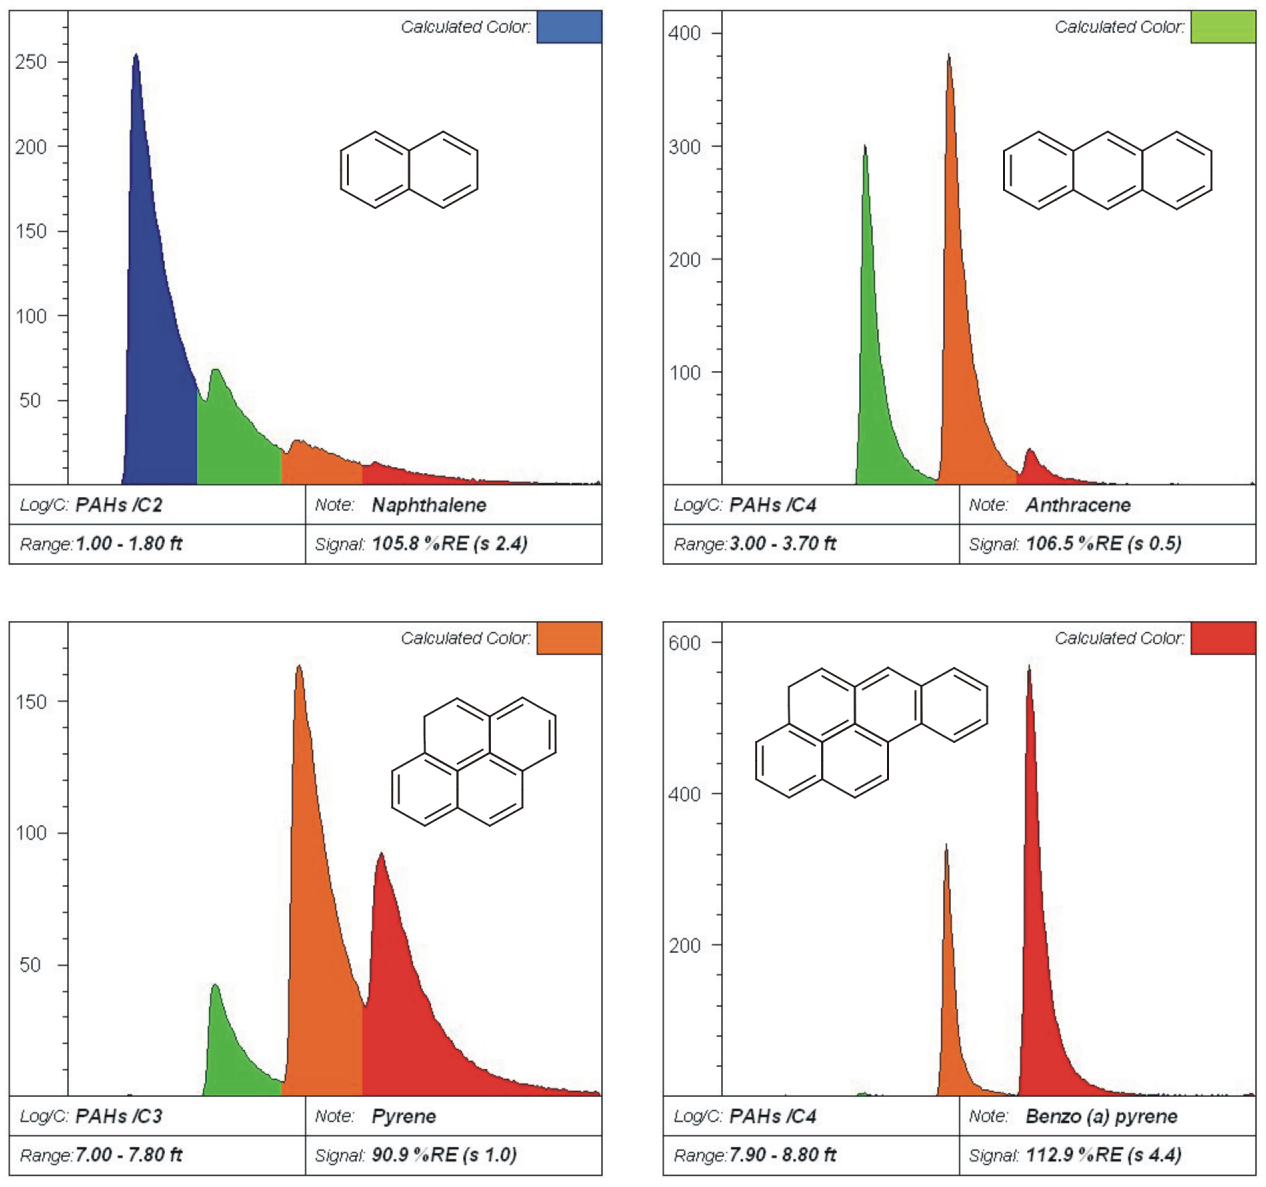
- One PAH will usually occupy more than one channel because PAHs generally fluoresce across a broad spectral range
- In general, the shorter wavelength channels (blue/green) are occupied by 2- and 3-ring PAHs, the middle (green/orange) by 3- and 4-ring PAHs, and the rightmost (orange/red) by 4-ring and larger PAHs
Lifetimes
- PAHs fluorescence lasts for only nanoseconds
- In the diesel example used in the above figure, the blue channel has a shorter lifetime (right side intensity falls back toward baseline quickly) than the green channel
- The lifetimes of some channels bleed into subsequent channels (green into orange) and influence the colorization
- Short lifetimes often indicate an energy transfer from the excited PAHs to surrounding, larger PAHs or matrix, leading to the quenching of fluorescence and red-shifting of the emission toward the right
- Long lifetimes often indicate lack of oxygen and/or a solvent-rich fluorescent friendly environment
Example Waveforms
PAH Waveforms

Fuel and Oil Waveforms

Weathering Waveforms

False Positives and Odd Waveforms
