An article from Randy St. Germain, president of Dakota Technologies, on using the fluorescence of PAHs to screen for NAPL.
Laser-induced fluorescence (LIF) employs laser light to excite fluorescent molecules contained in the majority of non-aqueous phase liquids (NAPLs) including petroleum fuels/oils, coal tars, and creosotes. Direct push logging of the NAPL’s inherent fluorescence with depth provides rapid and cost-effective delineation of NAPL. Multiple LIF logs conducted at NAPL release sites provide a relatively non-subjective basis for a detailed NAPL conceptual site model.
[For purposes of simplicity this article focuses principally on ultraviolet (UV) LIF’s application toward petroleum fuels/oils, not creosotes and coal tars, which demand visible wavelength LIF.]
BACKGROUND: Laser light is “clean” (narrow in wavelength) and relatively powerful. As such, laser light is readily transmitted with fiber optics, allowing scientists to deliver laser light remotely to samples and bring any light resulting from interaction with the laser back for analysis. Spectroscopists (those who study matter with light) discovered long ago that polycyclic aromatic hydrocarbons (PAHs) are highly fluorescent, and many of their spectra were catalogued decades ago1. To coax them into fluorescing you must excite PAHs into an electronically excited state by shining the correct color of light at them. They will absorb that light and, in a matter of nanoseconds, emit some light of their own as a way of getting rid of the excess energy they had gained.
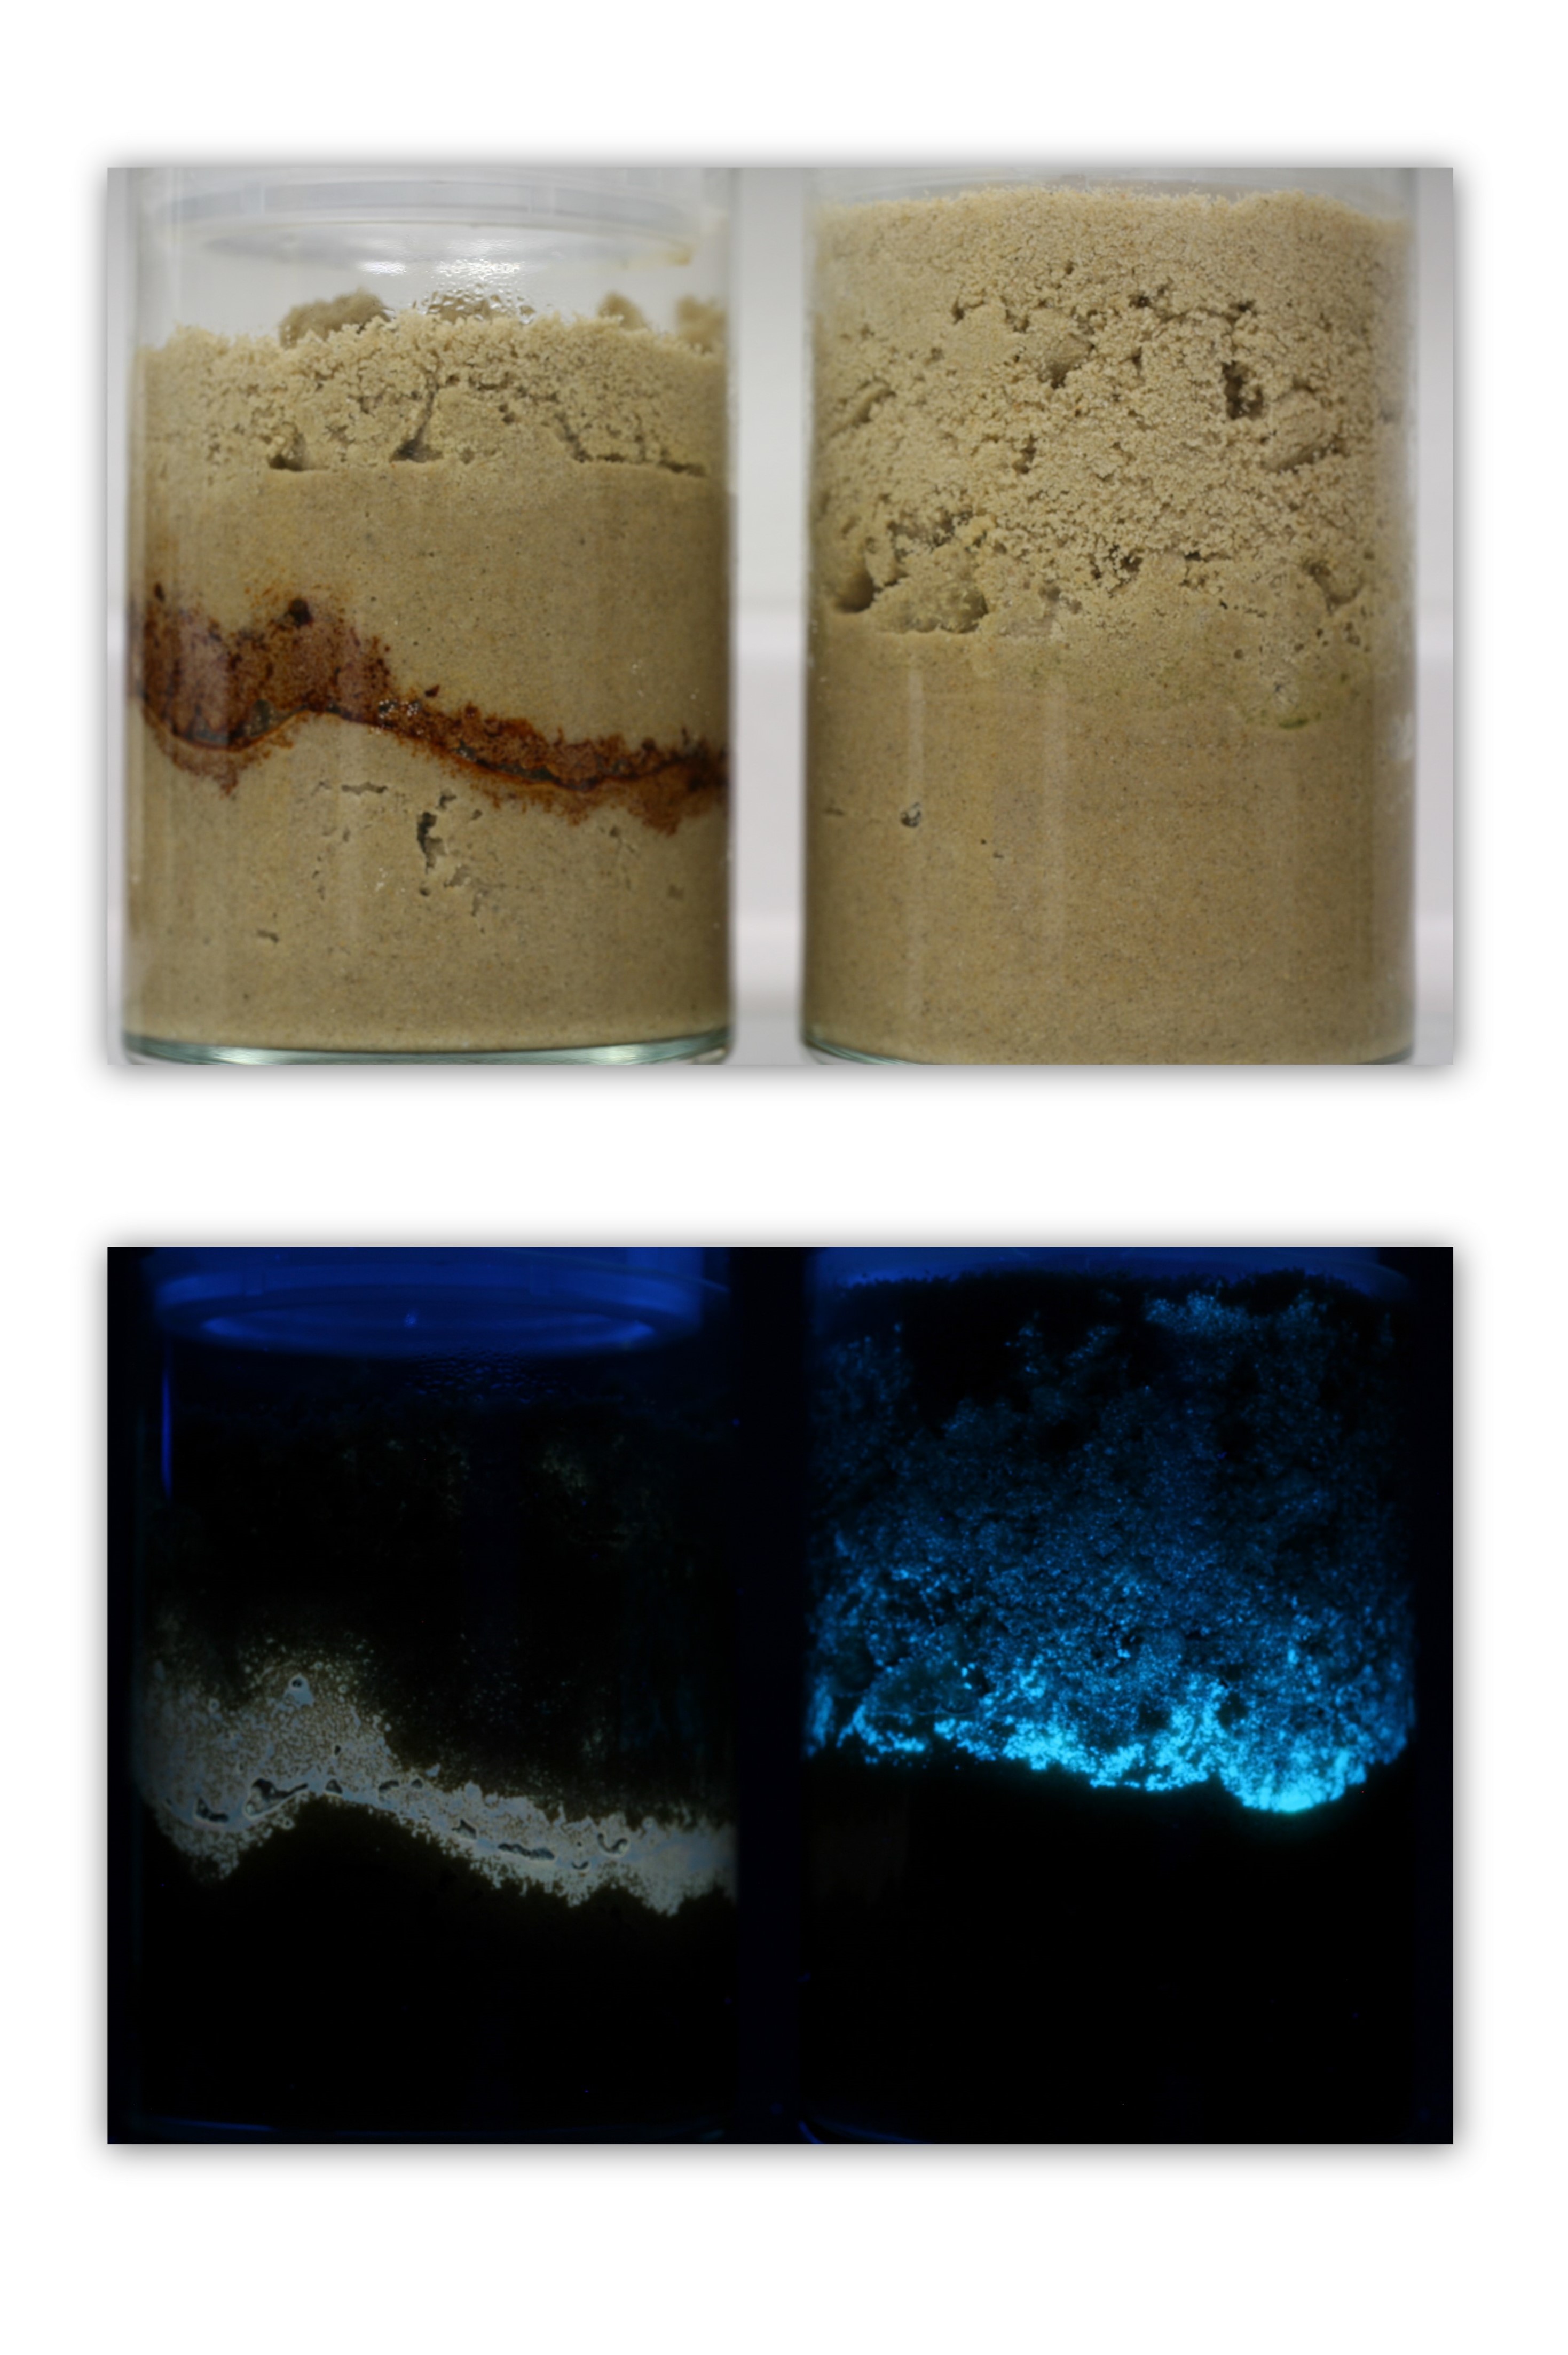
The color of the emitted light is “Stokes shifted” (of lower energy or longer wavelength than the exciting light) and is dependent on the number of rings and degree of substitution of the PAH that emits the fluorescence. Petroleum NAPLs, as it turns out, usually contain enough PAHs to be detected with LIF (even gasoline). This is illustrated in the photos below showing layers of crude oil and diesel on wet sea sand, which demonstrate the utility of fluorescence for “seeing” petroleum NAPLs.
Notice the different fluorescence color being emitted. This is due to the two NAPLs’ differing PAH distribution/content. Notice also that the “core” of the NAPL is brightest and the edges get fainter. This is because fluorescence scales monotonically with the amount of oil/fuel in the pore spaces. There are many exceptions to this monotonicity, but it’s typical for a single fuel/oil on a single soil type.
Finally, while the photographs can’t capture lifetime information, the PAHs in the crude oil and the diesel are emitting varying colors of light over varying periods of time, allowing further differentiation by LIF systems that are designed to log both the spectral and temporal nature of the emitted light.

Photographs of crude oil (left) and diesel fuel (right) on water-saturated sand under room light (top) and long wavelength ultraviolet lamp excitation (bottom).
BASIC METHOD:
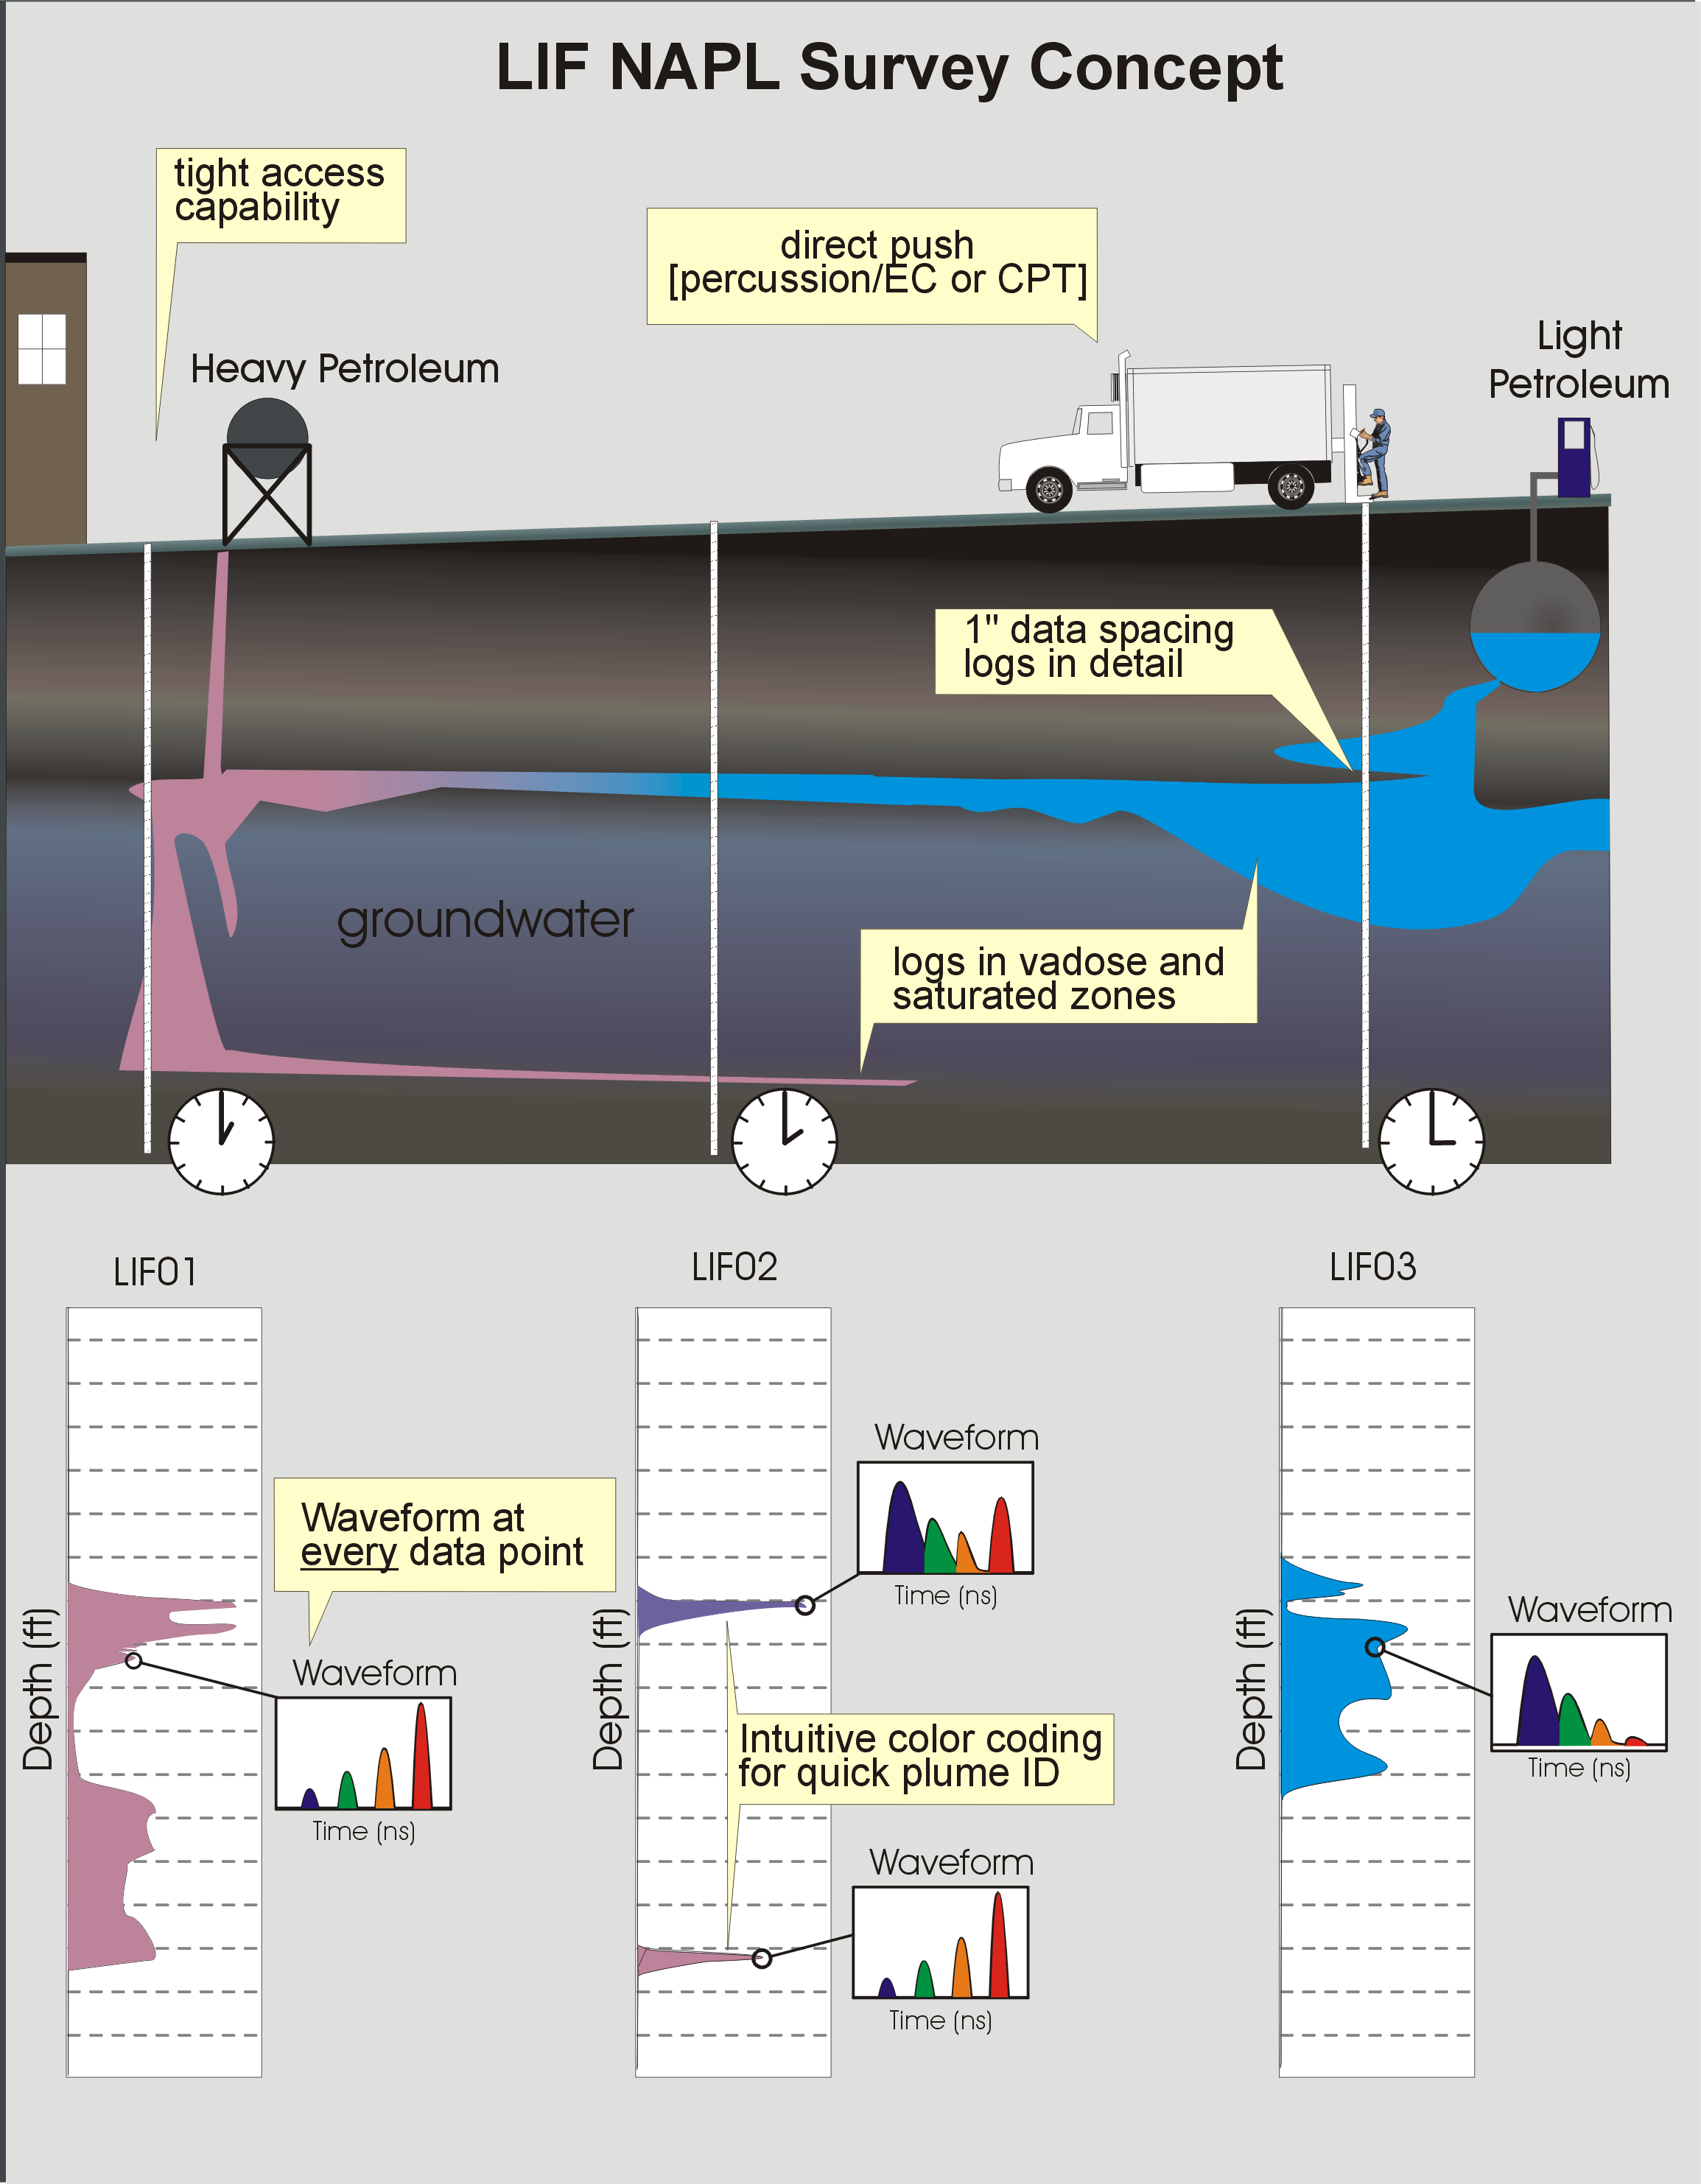
Commercially available LIF screening tools take advantage of the same phenomenon shown in the photograph. However, instead of the fuels/oils emitting light from behind the ‘window’ of the clear jar, a clear sapphire window is fitted into the side of a direct push probe that is pushed through the soil column (see illustration below). As this sapphire-windowed probe is advanced steadily into the soil column at ~2cm/second, pulses of laser light are sent down the rod string via fiber optics, where they exit the window and shine onto the face of the passing soil (without penetrating into the formation). Any resulting fluorescence and/or scattered laser light that comes back into the window is brought uphole by a second fiber, where the light is processed and analyzed in real time.
LIF systems log up to 100 ft below the surface with an “average” LIF log being about 35 ft and taking approximately 45 minutes start to finish. The logs indicate in real time exactly where NAPL fluorescence is occurring, with major differences in the fluorescence color and lifetime due to differing NAPL types, weathering, or false positives. The goal is to quickly and nonsubjectively survey the subsurface to generate a “machine vision” electronic data set used to develop a NAPL conceptual site model (CSM).

Concept diagram of NAPL site investigation with LIF. Direct push logging generates 300-400 ft of detailed information daily, spread across 8-14 locations, allowing for rapid assessment of the nature and extent of NAPL.
BASIC LIF DATA INTERPRETATION:
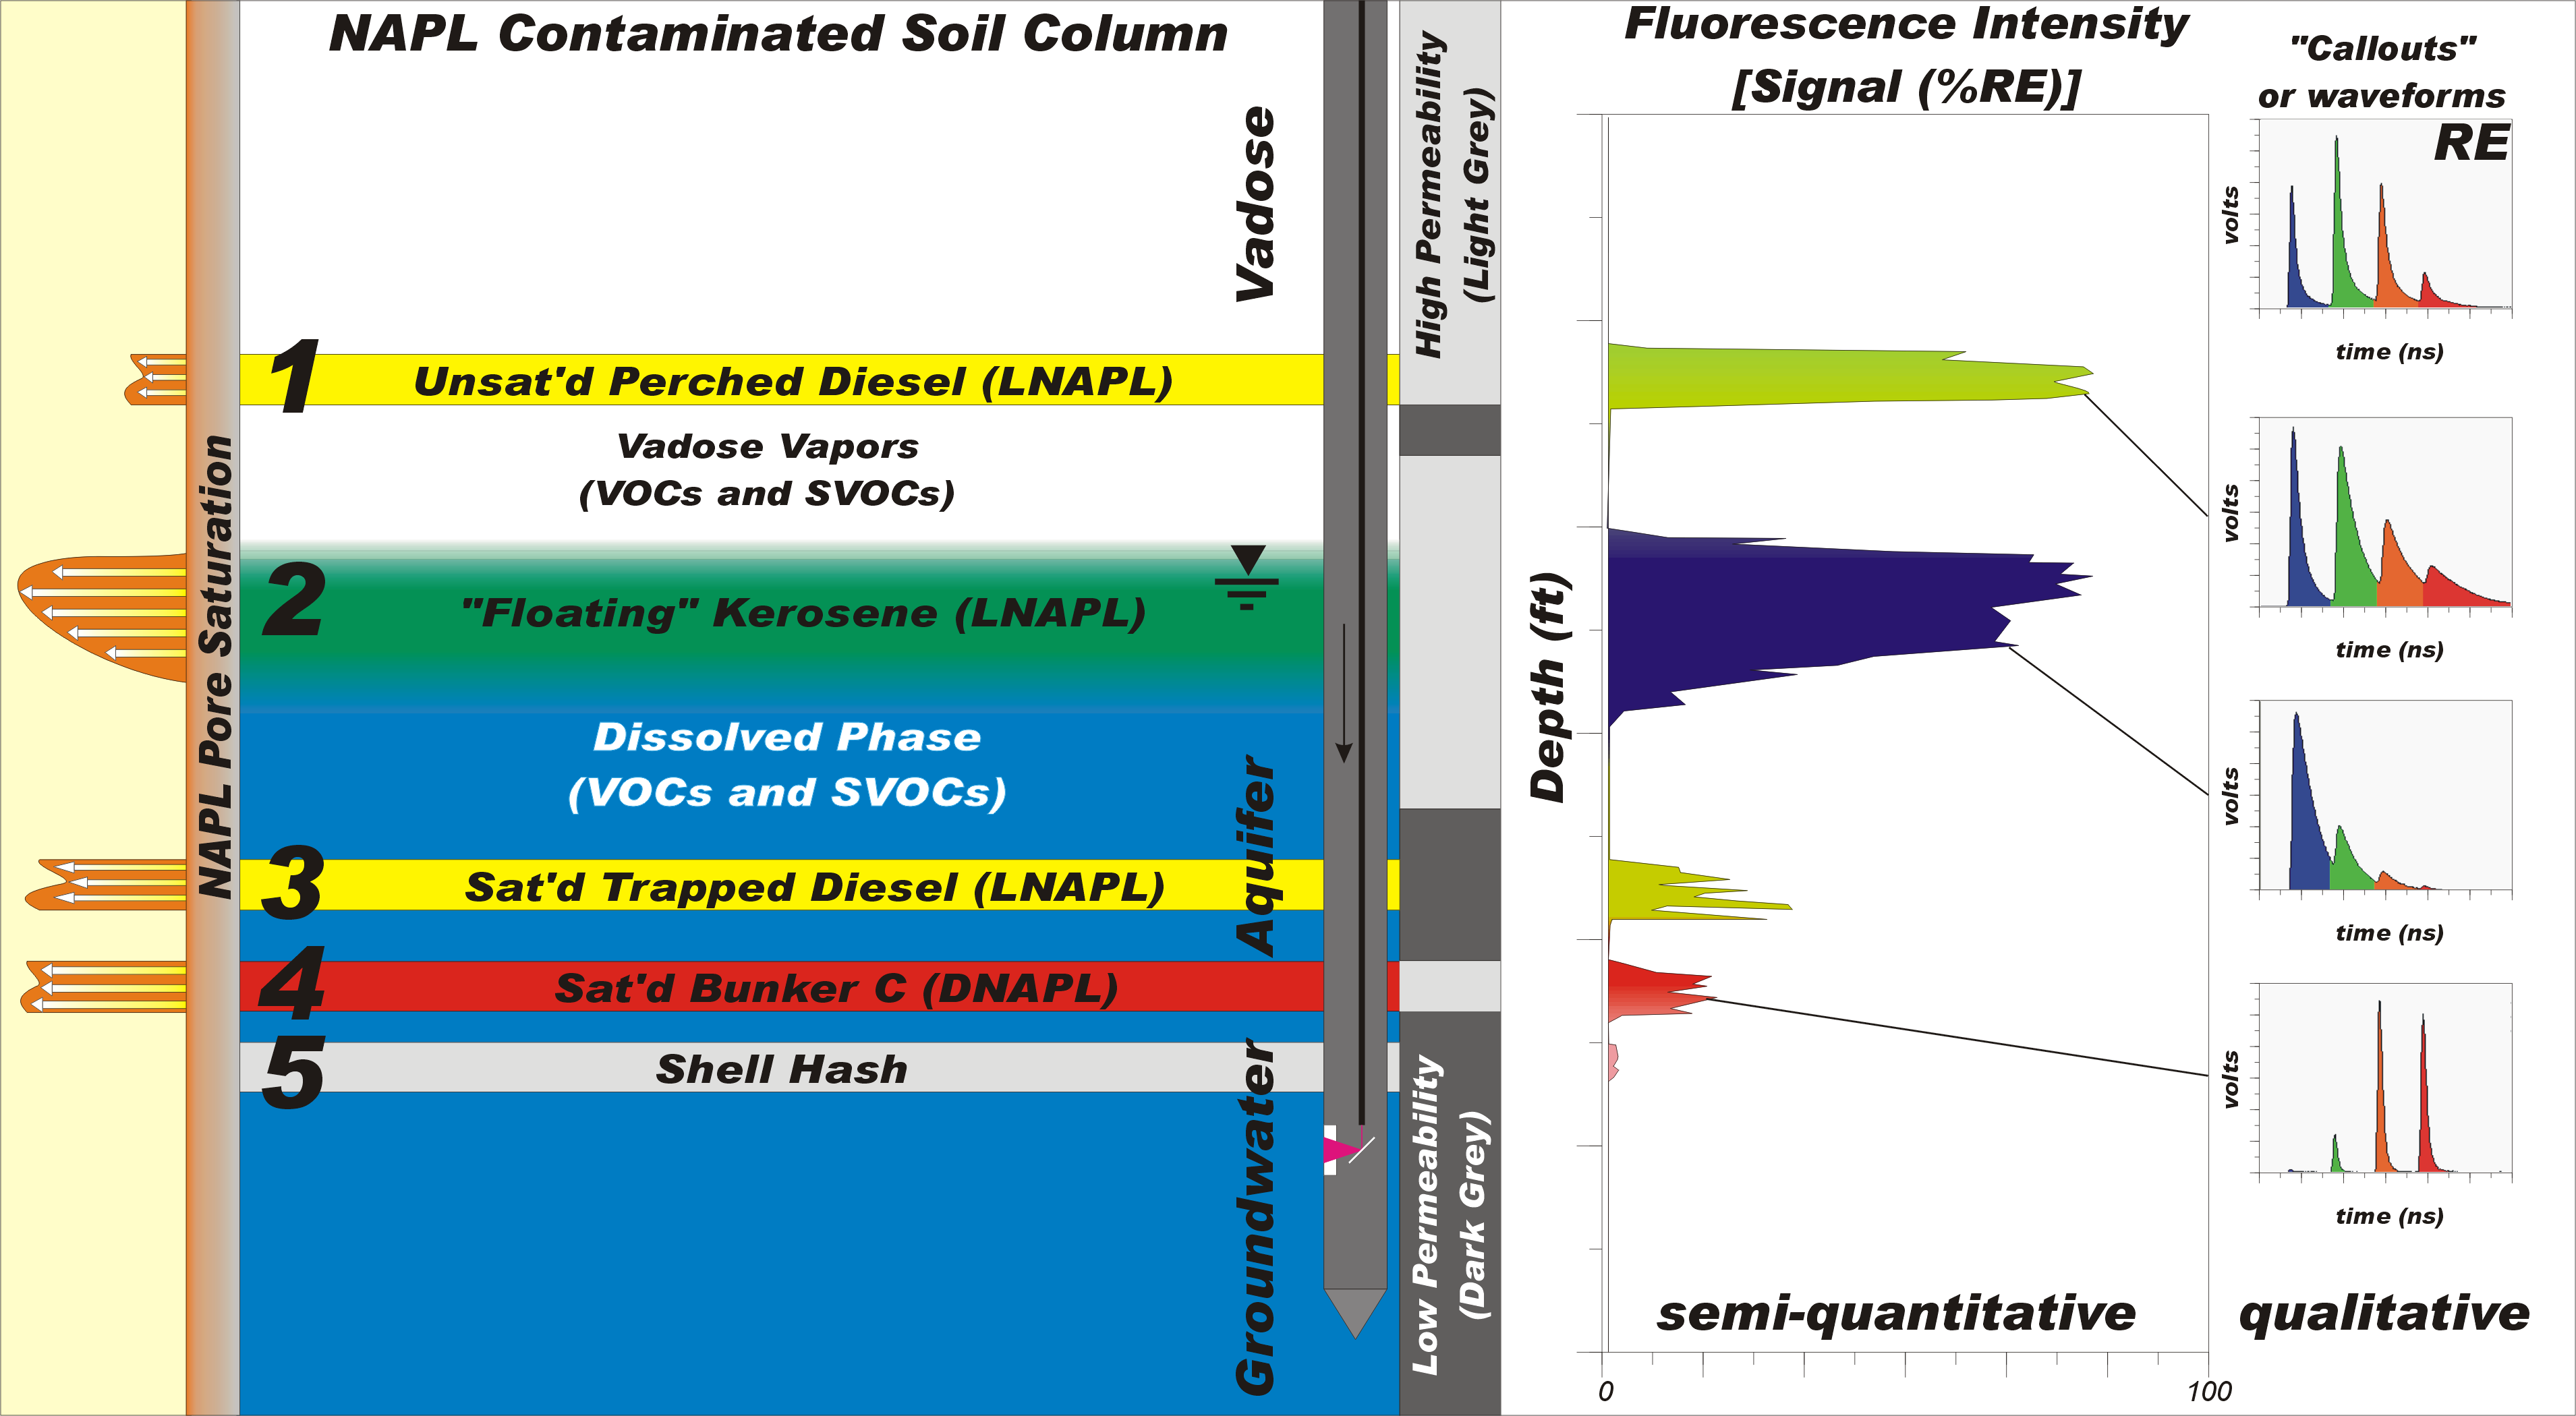
The simulated logging scenario in the illustration below contains many classic situations that are encountered during a typical LIF investigation. Four distinct mobile NAPL intervals in the vadose and saturated zones (far left saturation curves) and a layer of NAPL-free shell hash occur within two primary soil types: coarse high permeability soils (sands/gravel) and fine grain low-permeability soils (silts/clays). Notice the LIF probe traveling down through the soil column in the diagram’s center. On the right is the resulting LIF log that would be generated in real time as the LIF probe is pushed/pounded steadily through the soil column.
The LIF log y-axis is depth below ground surface, while the x-axis is fluorescence intensity or Signal %RE. The fluorescence signal typically scales monotonically with NAPL pore saturation. The RE stands for Reference Emitter, which normalizes the LIF response similar to using a tank of 100 ppm isobutylene to normalize the response on a handheld PID. The RE is a cuvette filled with a stable fluorescent NAPL that is placed on the sapphire window and recorded prior to each and every LIF log. It serves as both a single point calibration and as an overall system check (RE should look ‘correct’ to the LIF operator).
The RE-labeled callout (waveform) at the upper right side of the figure is not attached to any depth of the log, because it wasn’t acquired at depth, but right before logging began. These callout waveforms are a rather complicated hybrid of both spectral (color) and temporal (lifetime) fluorescence information. The full nature and utility of waveforms will be covered in detail in future articles. Until then, suffice it to say that for UV LIF, waveforms from fuels dominated by 2-ring PAHs (like naphthalenes in kerosene), are heavily weighted toward the first (blue) channel. Diesel has a broad distribution of 2, 3, and 4 ring PAHs, so it’s lit up across all channels (blue, green, orange, and red). Bunker fuel’s fluorescence is dominated by the larger 4 and 5 rings, so its fluorescence waveform is right-weighted (high in the orange and red channels).
The x-axis (Signal %RE) of the LIF log is total fluorescence (area) of each of the hundreds of waveforms acquired during the log, divided by the total fluorescence under the RE waveform. Keep in mind that the voltages on the y-axes of the callout waveforms are typically not all scaled the same, so be careful of this when examining LIF logs. Operators usually “zoom in” on the y-scale of the waveforms so the waveform shape can be clearly seen - because the shape tells us a lot about the nature of the NAPL (or may indicate it is NOT NAPL).
As the LIF probe passes through the clean upper vadose zone of our soil column we see that the LIF fluorescence response is low (background) because most soils that are NAPL-free have near zero fluorescence of their own. That’s because LIF measurement in/on opaque materials like soils does not have enough sensitivity to detect the relatively tiny quantity of PAHs that exist in soil pore gas, let alone the mono-aromatics or aliphatics that don’t fluoresce.
As we enter level 1 and the LIF window encounters the ~20% pore saturation layer of perched diesel, we see a large “green” response on the x-axis of the LIF log because the diesel is fluorescing. You’ll notice it approaches 80% RE, which is a fairly robust signal. See the second callout down? That single waveform was acquired at the depth shown tagged to this waveform with a line. Waveforms are acquired and stored every inch or so, the operator simply chose this one to represent the many “green” waveforms acquired while passing through the perched diesel lens. The waveform shown is a ‘classic’ diesel waveform – very few NAPLs other than diesel have this waveform.
So why is the perched diesel’s fluorescence response filled with the color green? That is the result of the mixing of the 4 colored peaks or channels of the perched diesel’s waveform. This technique of fill-coloring the log allows us to see at a glance which depths have similar or differing fluorescence characteristics (different waveforms). The perched diesel occurs in the permeable sand/gravel layer, which enhances the fluorescence response because high permeability soils allow more diesel to press up against the sapphire LIF window (versus finegrained soils which displace the NAPL), so a healthy 80% RE response is achieved.

Cross-sectional diagram showing the relationship between NAPL type, matrix, and saturation of pore spaces with NAPL vs LIF data.
Below the diesel-affected sand/gravel lens we pass through the clay layer on which the diesel was perched, and the fluorescence signal goes back to baseline in less than an inch. This is common, as LIF is a nearly instantaneous measurement.
As we pass through level 2 (a classic ‘floating NAPL’ layer) we notice that the LIF response rises and falls in concert with the NAPL pore saturation, and generates a response graph just like the NAPL saturation curve on the far left2. We’ve been seeing these “shark’s fin” curves at homogeneous course sand/gravel sites for decades. Notice the LIF log’s fill color is blue rather than green - and the waveform is very different. That’s due to naphthalenes (2-ring PAHs) which dominant the PAHs in kerosene. The blue fill is the resulting fill color calculated by the waveform’s blue channel dominance. In addition, notice that even though the kerosene is at 100% pore saturation, its fluorescence is only registering the same Signal %RE as the 20% pore saturation diesel above it. That’s because kerosene is less fluorescent, by about a factor of 5, than diesel, due to kerosene’s lower PAH content. We simply have to live with the variable fluorescent nature of different fuels/oils.
As we exit level 2 we exit the diminishing kerosene NAPL and enter high dissolved-phase BTEX and PAHs (especially naphthalenes as they are the most soluble of all PAHs). But again, the LIF appears to be “missing” these too. That’s because while PAHs are highly soluble in NAPL, the water can only hold 1/100th to 1/1,000,000th as much PAHs as the NAPL. LIF can and does detect dissolved phase PAHs in clear water, but not when it’s mixed up in opaque muddy soil. So remember, LIF is generally blind to dissolved phase, it only responds to the NAPL.
As the probe enters level 3 the window passes by a macropore or fracture of saturated diesel that was pushed down into and subsequently trapped below the groundwater table. We see that the pore saturation (in that macropore fracture anyway) reaches near 100%, but the fluorescence is only 20% RE, which is much less than the 80% RE fluorescence the LIF system logged when the probe window was in only 20% pore saturation diesel in layer 1. That’s because fines, especially clays, “hide” the NAPL from the laser/optics, causing up to a factor of 10 reduction of fluorescence response in clays than in sands/gravels. Many sites exhibit a response only in the sands/gravels because that’s where the NAPLs can travel.
Notice that while the diesel response is lower than in level 1, the greenish color is the same, suggesting the diesel waveform (not shown, but it would be the same regardless of soil type). It’s worth noting here that trapped fuels/oils such as layer 3 are actually common, especially in fine-grained, low permeability soils like clays with fractures and glacial tills. In many cases LIF has discovered entire NAPL plumes 5-10 feet below the current and/or historical groundwater table lows. Remember that NAPL is where you find it, and relatively few “sandbox” sites exist where the shark’s fin saturation curve can form in a homogenous soil column. One of LIF’s gifts to the industry is the eye-opening data it has generated showing that many NAPL CSMs based on boring log samples and wells are simply wrong.
Next the LIF probe passes into level 4 where saturated bunker fuel (DNAPL) sank down and penetrated laterally into a sand lens. The UV LIF being used here responds to the bunker, but barely, and not monotonically. Visible wavelength LIF should be used here (and for all coal tars and creosotes) if bunker is the main target of the investigation. This is because the visible LIF system responds monotonically to these “heavies” by design. Something called energy transfer quenches the fluorescence when UV is used, so the response is simply MUCH lower for heavies with UV fluorescence than one would expect. The very narrow lifetimes (skinny channels in the waveform) are direct evidence of the energy transfer quenching the LIF process.
Virtually all heavies show this right-sided waveform dominance, short lifetimes, and orange-red color-fill on the LIF log. But energy transfer and heavies are another advanced topic to address in a later edition. In any event, the response is unexpectedly low, even though the bunker is 100% pore saturated and it contains substantially higher PAH content than the other fuels. When you see this waveform and color-fill you should realize that you might have much more NAPL down there than the small %RE suggests.
Finally we pass into level 5, a layer of shell hash. Notice that the LIF log contains a “bump” in the fluorescence at this depth, even though the shell hash is clean of NAPL. That’s because sea shells, calcareous sands, peats, wood, and other atypical organic soils can and do fluoresce (typically < 20% RE). Notice the fill-color is an odd pink that doesn’t match any of the other fillcolors on the log.
Had we highlighted one of the shell hash waveforms with a callout we also would have seen the waveform itself was “different” from the other waveforms, signaling to us that this material is not similar to the other NAPLs we encountered and that it may be a false positive material we pushed through at that depth. It is often the case that these false positives, while they make LIF interpretation less straightforward, can be identified as such and are later confirmed with a sample or two in depths identified precisely in the LIF log.
SUMMARY:
So let’s review some key elements of LIF screening tools:
- LIF detects the PAHs in NAPL and this is how it logs for NAPL vs depth
- LIF is compatible with both cone penetration test (CPT) and percussion based direct push drilling technologies
- LIF is a mature technology, with hundreds of miles of LIF logging at hundreds of sites in the last 20 years
- LIF is logged continuously with depth (2cm/second) - no data gaps or partial recovery
- Typical LIF production is 300-400 ft/day - spread across 8-14 locations
- Experience has taught us there is almost never pulldown or sloughing of NAPL on the probe except when probing through the very softest of soils (pudding)
- Waveforms (and color-fill logs derived from waveforms) help us differentiate between NAPL types and differentiate NAPLs from false positives
- LIF detects NAPL equally well in both the vadose and saturated zones
- LIF’s detection limit ranges between 10 and 1000 mg/kg (TPH), depending on fuel type and sol matrix
- LIF does not respond to dissolved phase VOCs or SVOCs
- LIF does not detect BTEX (excitation wavelength for BTEX is incompatible with fiber optics)
- Soil matrix affects fluorescence - sands/gravels have ~10x higher response than clay/silt
- LIF’s potential false positives include shell hash, meadow mat, peat, wood, and calcareous sands, but waveforms usually identify these as suspect
- LIF does not detect chlorinated solvent DNAPL because they aren’t fluorescent molecules – exception is chlorinated DNAPL that contains enough fluorophores (degreasing, industrial waste, etc.) - which is about 25% of DNAPLs tested recently
- UV LIF should NEVER be used to delineate coal tars and creosotes, use visible LIF instead – some of these materials don’t fluoresce at all or have non-monotonic responses
- Tracer dye injections can and have been delineated with LIF
While it does have limitations that need to be understood and managed, LIF is a very rapid and thorough method of determining nature and extent of a petroleum site’s source term NAPL. LIF surveys almost always reveal that previous NAPL CSMs based on standard sampling or monitoring well apparent NAPL thicknesses are deficient, if not grossly flawed, in comparison.
REFERENCES:
1. Berlman, Handbook of Fluorescence Spectra of Aromatic Molecules, Second Edition, ACADEMIC PRESS, 1971
2. ITRC’s Internet-based Training Program, LNAPL Training Part 2: LNAPL Characterization and Recoverability – Improved Analysis, slides 29, 49. http://www.cluin.org/conf/itrc/LNAPLcr/prez/ITRC_LNAPL_Part2_052711ibtbw.pdf
To download a .pdf version of Randy’s article in the Applied NAPL Science Review, click here. Also, stay tuned for future editions of the LIF Line to read more articles on this topic.